I. EXPLORING EXISTING LITERATURE
This week, I will explore the available sources of bioinformatics data that are currently available on the internet right now. Since COVID-19 was first discovered in Hubei at the end of 2019, labs all across the world has been working hard to sequence the genome of this Coronavirus. While this is hard and expensive work, it is crucial for tracking how the disease is spreading across the globe as well as identify methods of intervention.
Since much work has already been done in identifying and analyzing COVID-19’s genome. It is worth the effort to read through and catch up on what has already been done and build on top of that work. Fortunately in the age of the internet, a lot of this research is already online, making it easy find other research.
A. GISAID Initiative
The GISAID Initiative stands for Global Initiative on Sharing All Influenza Data. It was set up by the German Government and nonprofits to provide public access to the most complete genome data on influenza and other diseases (such as COVID-19). GISAID provides valuable tools such as tracking the epidemiology of Influenza to try to predict which strain is most likely to occur as well as provide recommendation for which strain of Influenza we should vaccinate against in the up coming flu season.
These tools were incredible valuable for influenza but due to the modular nature of GISAID, it is currently being applied to COVID-19. GISAID provides a fantastic chart about the epidemiology of COVID-19 showing how mutations occured from the original strain discovered in late 2019. Also, they provide a dashboard that shows confirmed cases, active cases, and the outcome of resolved cases. From GISAID and the information they provide, I learned the following:
CASES OF CORONAVIRUS: As of 4/7/2020, there are 1.4 million confirmed cases of COVID-19 with 81,000 deaths and 300,000 recovered. Most of the new cases of COVID-19 are outside of China (Europe and the US). Currently, the US has the most confirmed cases of COVID-19 at 398,000 cases and Italy with the most deaths at 17,000 deaths.
EPIDEMIOLOGY OF COVID-19 IN THE US: GIDAID’s epidemiology chart allows us to track and see when and where the viruses were identified in the US. Additionally, it also tells us where it most likely came from. The following are some key events when it comes to COVID-19 arriving in the US.
- MN985325: Man travelled from China diagnosed in Snohomish County, WA
- MN988713: Man travelled from China diagnosed in Chicago, IL
- MN994468: Man travelled from China diagnosed in Orange County, CA
- Mutation occurred in Europe: Major mutation occured in Europe on 1/16/2020
- 419553: First person diagnosed with COVID-19 that traced back to Europe in Rhode Island
- Currently two clusters of COVID-19 Phylogeny in the US. One cluster originating from China, the other originating from Europe
B. Folding at Home
Folding at Home is a project sponsored by Oracle that allows people to pool together researches for protein folding simulations. These simulations are useful because they allow us to see how viruses behave and to observe protein behaviors that often goes undetected in lab experiments. An example they gave was Ebola, where the team was able to find an opening that could potentially allow therapeutics to take effect. Folding at Home hopes to accomplish the same for COVID-19 where they can discover therapeutics for the Coronavirus through protein interactions otherwise unobservable in laboratory experiments.
C. Complete Genome Sequence of a SARS-CoV-2 Strain Isolated in Nepal
This paper (published by the American Society of Microbiology) explained the process undertaken by the University of Hong Kong to sequence the Genome of COVID-19 (then still known as SARS-CoV-2). The Chemical process of sequencing the genome (rRT-PCR developed at the University of Hong Kongs) is complicated process that is quite difficult to understand, however the results are quite simple to interpret.
- SARS-CoV-2 Nucleotide Sequence Length: 29,811 nucleotides
- Nucleotide Composition:
- 29.86% adenosines
- 18.39% cytosines
- 19.63% guanines
- 32.12% thymines.
- Mutations from COVID-19 Sequenced in Wuhan:
- ORF1a, codons AGT to AGC, silent mutation
- ORF1a, codons TTA to TCA, nonsilent mutation
- ORF1b, codons CTA to TTA, silent mutation
- ORF8b, codons TCA to TTA, nonsilent mutation
- nucleocapsid, codons TTT to TTC, silent mutation
- Deamination Location from COVID-19 Sequenced in Wuhan:
- Site 24019 vs 2019-nCoV WHU01
- Site 24019 vs Wuhan-Hu-1
- Similarity with COVID-19 Sequenced in Wuhan: > 99.99%
D. Conclusion
Since December 2019, a huge amount of research has been done on this Coronavirus making it one of the most thoroughly studied virus. However, there is still a lot of work to be done to fully understand how the virus works and what we can do to stop it. A lot of information is floating out there on the internet yet to be analyzed and understood. It is the purpose of CSC448 to both teach me how to do that type of analysis as well as contribute to the scientific community.
II. COVID-19 PHYLOGENETIC TREE
When a new disease emerges, one of the first things we do is to identify where the disease came from and when the disease crossed over to humans. With the 2002-2003 SARS outbreak, scientists used a phylogenetic tree to trace where the virus came from. Using this technique, bioinformaticians hypothesized that the SARS virus likely came from civet cats who likely got it from a bat. Below, I will run a similar analysis but on SARS-CoV-2.
A. Data Retrieval
I got all my data from the NCBI Nucleotide Database queried with the Entrez tool by their accession number. I looked up their accession number by searching for Coronaviruses at the Nucleotide database on their web interface https://www.ncbi.nlm.nih.gov/nuccore. I searched by different types of viruses and the following are the viruses I choose with their accession number and host animal.
| index | accessions | host | sequence |
|---|---|---|---|
| 0 | NC_009019.1 | Tylonycteris | GATTTAAGTGAATAGCCTAGCTATCTCACCCCCTCTCGTTCTCTTG… |
| 1 | GQ477367.1 | canine | ACTTTTAAAGATAAAGTGAGTGTAGCGTGGCTATCTCTCATCTTTT… |
| 2 | MK994937.1 | swine | ACATGGGGACTTAAAGATATAATCTATCTGCCGATAGAGTCCTTAT… |
| 3 | KX722530.1 | feline | GTGAGTGTAGCGTGGCTATAACTCTTCTTTTACTTTAACTAGCTTT… |
| 4 | U00735.2 | bovine | GATTGTGAGCGATTTGCGTGCGTGCATCCCGCTTCACTGATCTCTT… |
| 5 | KF268339.1 | murine | TACCCTCTCAACTCTAAAACTCTTGTAGTTTAAATCTAATCTAAAC… |
| 6 | NC_009657.1 | Scotophilus | GACTTAAAGATATTATCTATCTATAGATAGATCAATTTCTTTCCTA… |
| 7 | JQ989273.1 | Hipposideros | ACATGGGGACTTATTGTGATTTTCTATCTGCGGATAGTAAGTGTCA… |
| 8 | NC_017083.1 | rabbit | GATTCTGAGCGATTTGCGTGCGTGCATCCGCCTCAGTGAACTCTTG… |
| 9 | MK359255.1 | goose | ACTTTGAGCATTGATATATATATATATATATCATACTCACCTTGCC… |
| 10 | NC_032730.1 | rat | ACTTTTAGAGTATAATCTATTATACATAGATTTGCACTAACCCCTC… |
| 11 | NC_010438.1 | Miniopterus | GACTTAAAGATATAATCCATCTAGCGACGGGTTATACTCTTTTTAG… |
| 12 | LC215871.1 | ferret | AGTGAGTGTAGCATAGCTGCCTACTTTCTTTAACTTGACTCTAAGT… |
| 13 | NC_023760.1 | mink | ACTTTTAAAGATAAGTGCGTGTAGCGTAGCTGCCCACCTTTCTTTA… |
| 14 | EF424621.1 | antelope | GCGTGCGTGCATCCCGCTTCACTGATCTCTTGTTAGATCTTTTCAT… |
| 15 | GQ427176.1 | turkey | ACTTAAGATAGATATTAATATATATCTATCAAACTAGCCTTGCGCT… |
| 16 | MT072864.1 | pangolin | TCCCAGGTAGCAAAACCAACCAACTCTCGATCTCTTGTAGATCTGT… |
| 17 | AY572034.1 | civet | AAGCCAACCAACCTCGATCTCTTGTAGATCTGTTCTCTAAACGAAC… |
| 18 | KF793825.1 | dolphin | CTATTTGTGAATAATATATATATATATATCATTCATTCGTTTACCC… |
| 19 | MN996532.1 | bat | CTTTCCAGGTAACAAACCAACGAACTCTCGATCTCTTGTAGATCTG… |
| 20 | MG518518.1 | waterdeer | GATTGTGAGCGATTTGCGTGCGTGCATCCCGCTTCACTGATCTCTT… |
| 21 | KM454473.1 | duck | TGCTGGTATCACTGCTTGTTAGGTTGTGTCTCACTTTATACATCCG… |
| 22 | NC_045512.2 | covid19 | ATTAAAGGTTTATACCTTCCCAGGTAACAAACCAACCAACTTTCGA… |
| 23 | NC_009020.1 | Pipistrellus | GATTTAAGAGAATAGCCTAGCTATCCCTCTCTCTCGTTCTCTTGCA… |
| 24 | MN996532.1 | Rhinolophidae | CTTTCCAGGTAACAAACCAACGAACTCTCGATCTCTTGTAGATCTG… |
| 25 | NC_018871.1 | Rousettus | ACATGGGGACTTATTGTGATTTTCTATCTGCGGATAGTAAGTGTCA… |
I will use these nucleotide sequences to create a phylogenetic tree to try to determine/re-confirm which species the virus originated from.
Instead of just using the Spike Protein Sequence like the lab, I will use the entire Nucleotide sequence which averages a length of 29472 nucleotides long. Although the textbook warned that using the entire sequence could be tricky as there are often rearrangements, insertions and deletions. However, complete sequences are the easiest set of data to compile.
B. Distance Matrix
The distance matrix was constructed using Levenshtein Distance. It is rather a length exercise derived from CSC349 so instead of writing it, I used the python-levenshtein package. I considered using the Damerau-Levenshtein distance but transposition added to a longer compute time, thus I settled for the Levenshtein distance. Levenshtein is the most optimal choice since or similarity measure in lab doesn’t apply for my dataset. This dataset are all sequences of different length and thus Levenshtein distance was necessary.
Since the sequence is the entire genome, there are a lot of noise in the data. Some of that noise could come from random mutations and just differences in the coronavirus type. It is my hope that by using Levenshtein distance, it could account and adjust for the random mutation so that it still gives us good results at the end. The code I used to generate the distance matrix is as follows:
d_mtrx = np.zeros((len(align_str),len(align_str)))
for i in range(len(align_str)):
    for j in range(i+1, len(align_str),1):
        dld = Levenshtein.distance(align_str.iloc[i], align_str.iloc[j])
        d_mtrx[i][j] = dld
        d_mtrx[j][i] = dld
C. Phylogenetic Tree
I used BioPython to create the Phylogenetic tree using the DistanceTreeConstructor. The code for it is as follows:
from Bio.Phylo.TreeConstruction import DistanceTreeConstructor
from Bio import Phylo

constructor = DistanceTreeConstructor()
tree = constructor.nj(dm)
tree.ladderize()
Phylo.draw(tree)
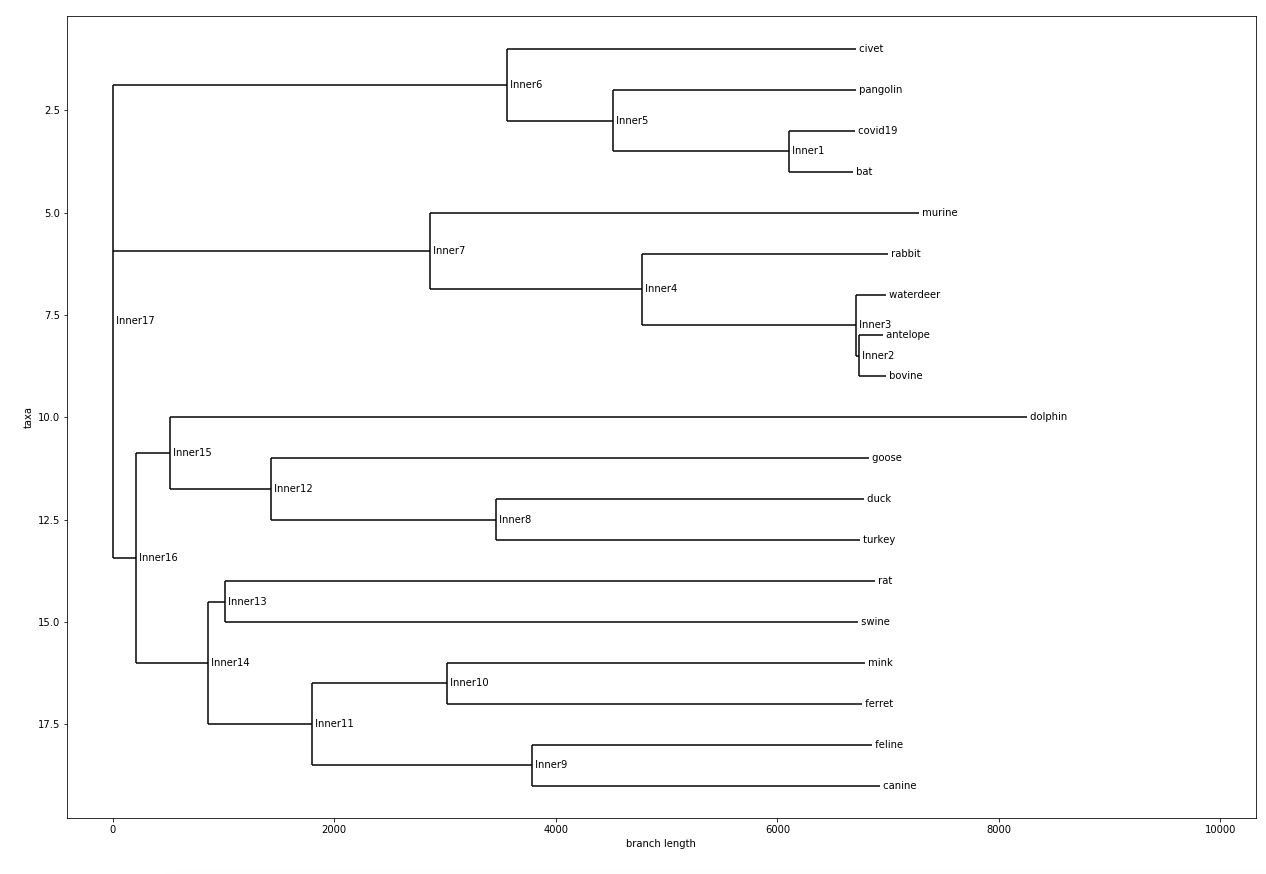
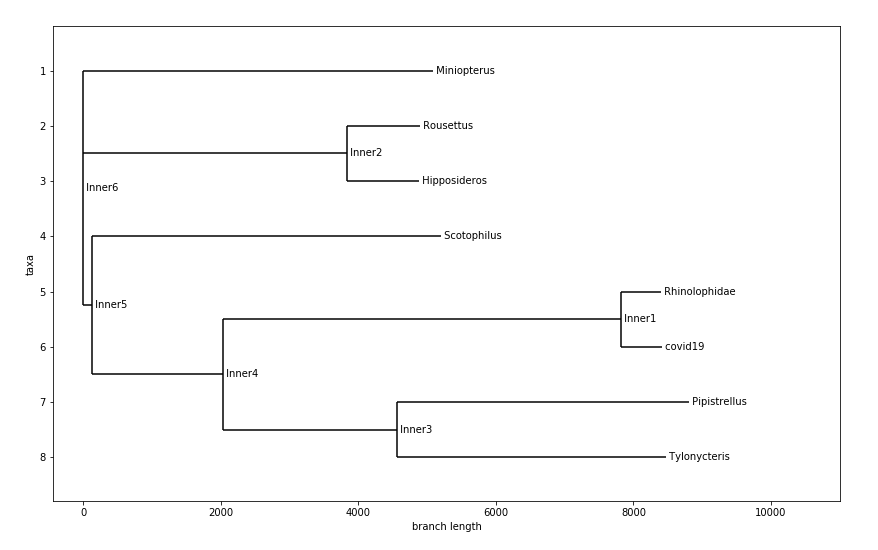
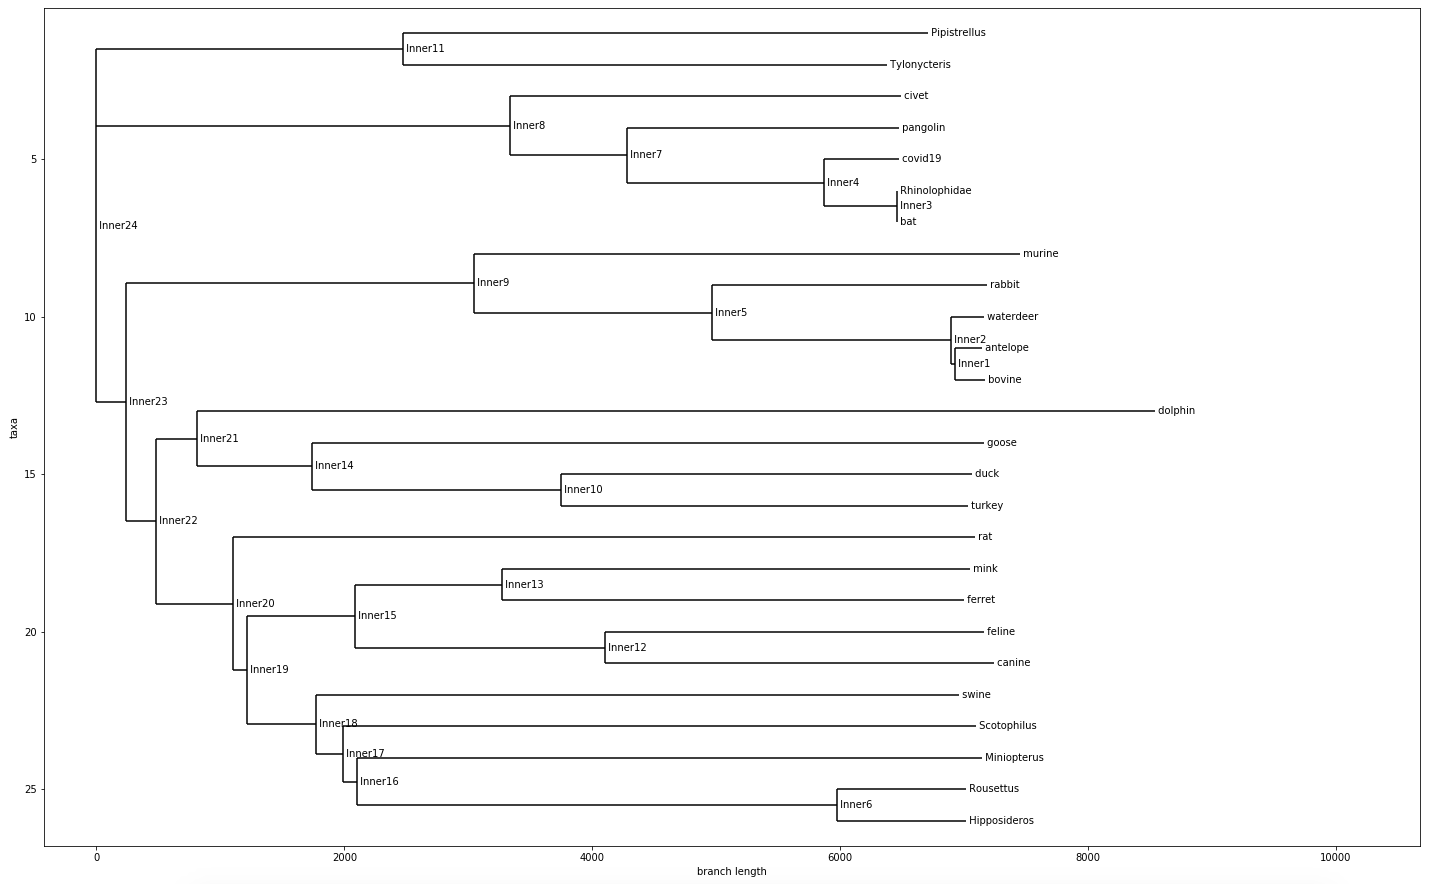
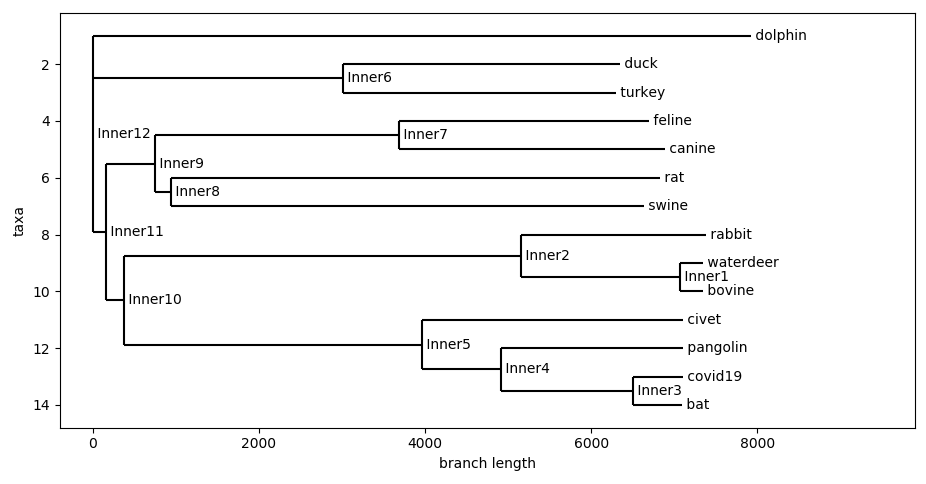
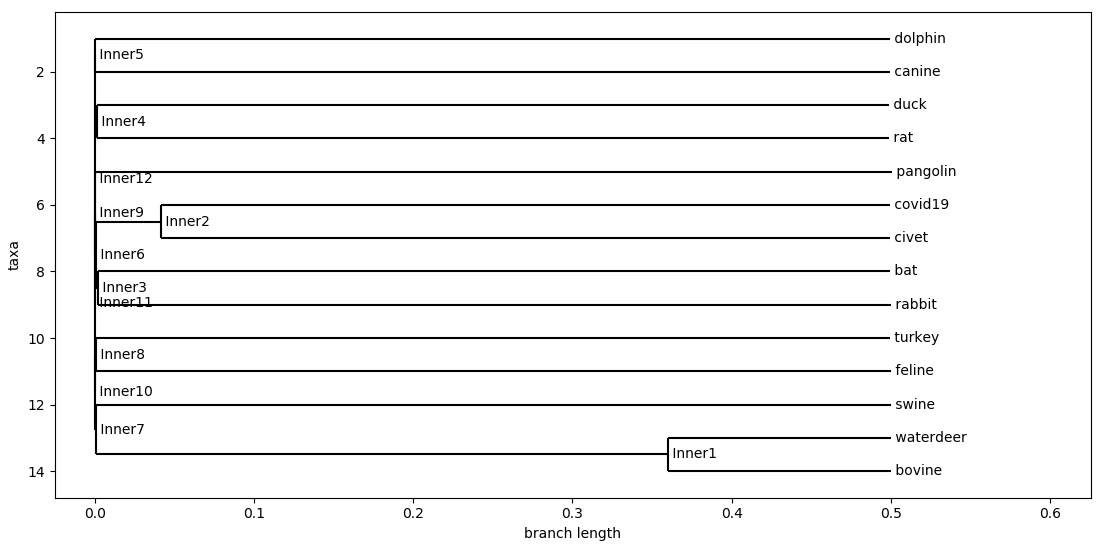
The following three phylogenetic tree was created:
Tree with Non-Bat Species
Tree with Just Bat Species
Tree with All Species
D. Conclusions
From all these Phylogenetic chart that was generated. We learned / confirmed that COVID-19 likely originated from bats, specifically the horseshoe bats. A study that came out in January 27th of 2020 also stated that the likely origins of COVID-19 is from bats.
This phylogenetic chart also showed me something very similar, which is that SARS and COVID-19 shared very similar origins. Both from horseshoe bats along the same evolutionary branch. This explains so much of why SARS and COVID-19 share such similar symptoms, and how it disproportionately affects different age groups.
III. Exploring Distance Metrics
A very useful property of phylogenetic tree is that it only requires a distance matrix to be generated. This distance matrix can be generated by any type of similarity metric. In this section, I will explore different distance metrics and use them to generated different distance matrix to see how it affects the phylogenetic tree. I will be using the the same genome as the previous section and the distances I will be exploring are as follows:
- Modified version of the Hamming Distance
- Damerau-Levenshtein Distance
- Jaccard Distance
- Cosine Similarity
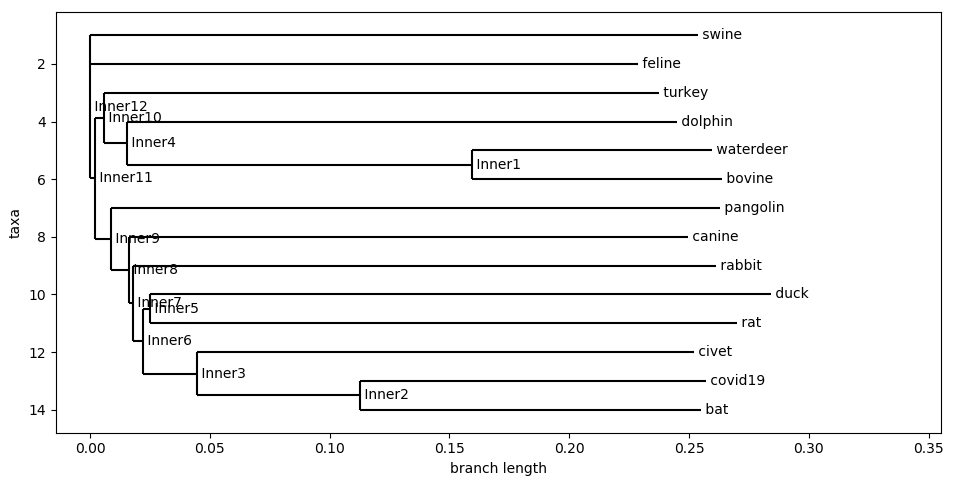
A. Modified Hamming Distance
The hamming distance takes in two strings of equal lengths and measures the number of characters that are different at each spot. For example, if we have the string Bryan and Brian, the hamming distance would be 1 because at location 3, the character y and i is different. Hamming distance in its original form won’t work because our sequences are of different length, thus I will exploy the modified hamming difference which adds the difference between the length of the two strings to the score at the end. The code is as follows:
def modified_hamming_distance(str1, str2):
    differences = 0

    if len(str1) != len(str2):
        differences += abs(len(str1) - len(str2))

    for x in range(len(str1)):
        if str1[x] != str2[x]:
            differences += 1

    return differences
Hamming Distance
This is a really simple measure of similarity between the sequences and offers an idea for how similarity individual nucleotides are to each other.
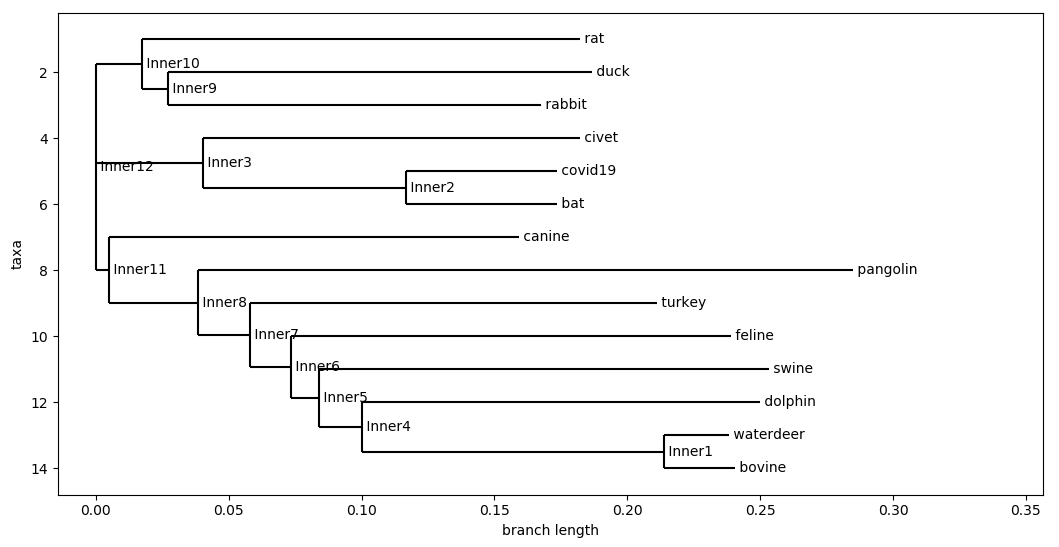
B. Damerau-Levenshtein Distance
The Damerau-Levenshtein distance is metric that is more specifically build for nucleotide comparison purposes. DL distance operations are insertion, deletion, tranposition, and substitution, all of which matches up with how genome mutate (also happens to do it on the same time scale as well). This is a good standard to compare all other metrics up against because it is capable of capturing both similarity as well as time it took for the genome to mutate.
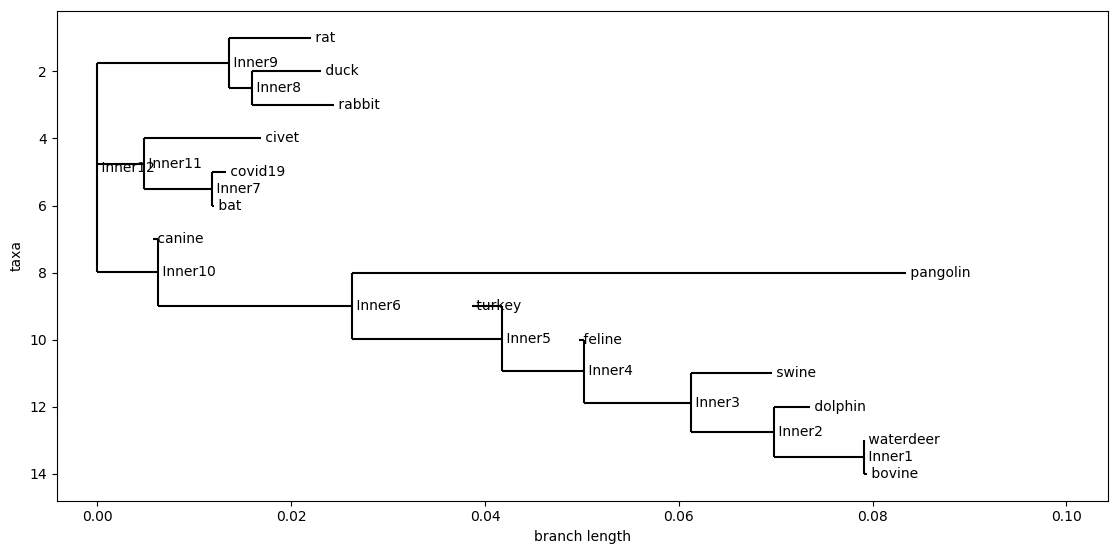
C. Jaccard Distance
In this application, the Jaccard distance was used to see how similar the k-mers are in the genome. In my code, I split the genome into 6-mers and used the Jaccard distance to measure similarity between the sets of k-mers between the genome. What the Jaccard distance is calculated by taking the number of k-mers they have in common divided by the number of k-mers there are in total. Note that Jaccard distance operates on sets, so no replicas are counted, this could both be a benefit and a drawback as it ensures that all k-mers are given equal weight, however it is incapable of distinguishing between important (more occuring) k-mers.
Ultimately, Jaccard distance tells us one thing, how many k-mers two genomes have in common. The more k-mers they have in common, it is more likely they came from the same evolutionary branch. The selection of k for k-mers is an arbitrary choice, however, in this case, I found that 6-mers captures the timescale of evolution the best. 12-mers compresses the present and 3-mers compresses the past.
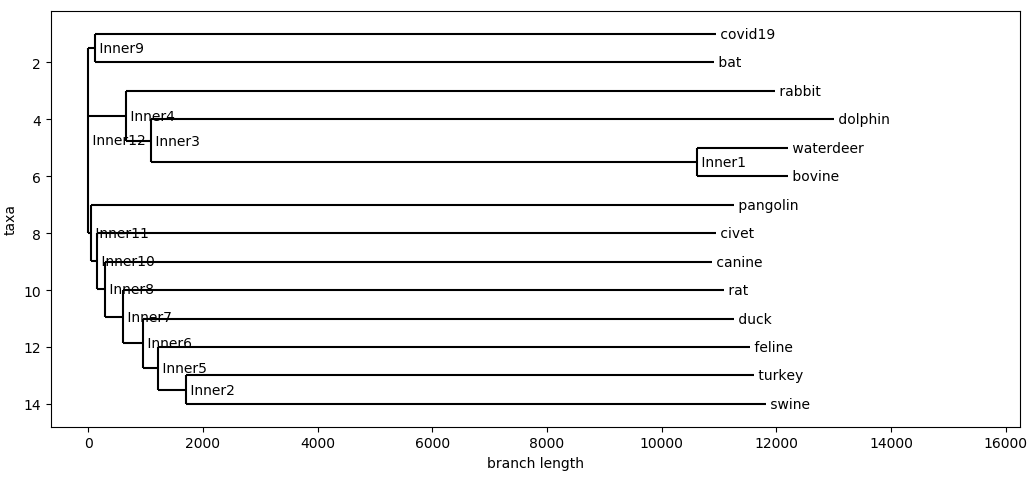
Jaccard Distance With 6-mers
D. Cosine Similarity
By far the quickest and computationally simple of these metrics. The Cosine Distance isn’t particularly set up for the purpose of genome comparison. However, it is a good metric to consider because of how quick it runs compare to the other algorithms. It is capable of providing good comparison of strings of k-mers at a much quicker time.
Cosine Distance With 3-mers
Cosine Distance With 6-mers
Cosine Distance With 12-mers
E. Conclusion
In conclusion, we learn a couple of things from using different distance metrics. Hamming distance is the fastest but it is not good at capturing the time scale of evolution. Jaccard distance just sucks in general. Damerau-Levenshtein distance is a good standard as it is able to simulate genome mutation but it is veryyyyyy slow. Cosine similarity offers a good mix of time scale and computational speed.